Using a divergent color palette can be beneficial when you want to draw attention to some values compared to a fixed point. Like temperature around freezing, monetary values around zero, and so on. However, it can be hard to align 0 to the middle of a continuous color scale. This post will explain how to do this correctly for scale_colour_distiller and scale_fill_distiller, and this will also work for extension packages such as scico.
Packages and data
library(ggplot2)
library(scico)

theme_set(theme_minimal())

example_data <- data.frame(name = letters[1:10],
                           value = -2:7 + 0.5)
The problem
First, let’s construct a simple chart, we have a bar chart where some of the bars go up, and some of the bars go down.
ggplot(example_data, aes(name, value)) +
  geom_col()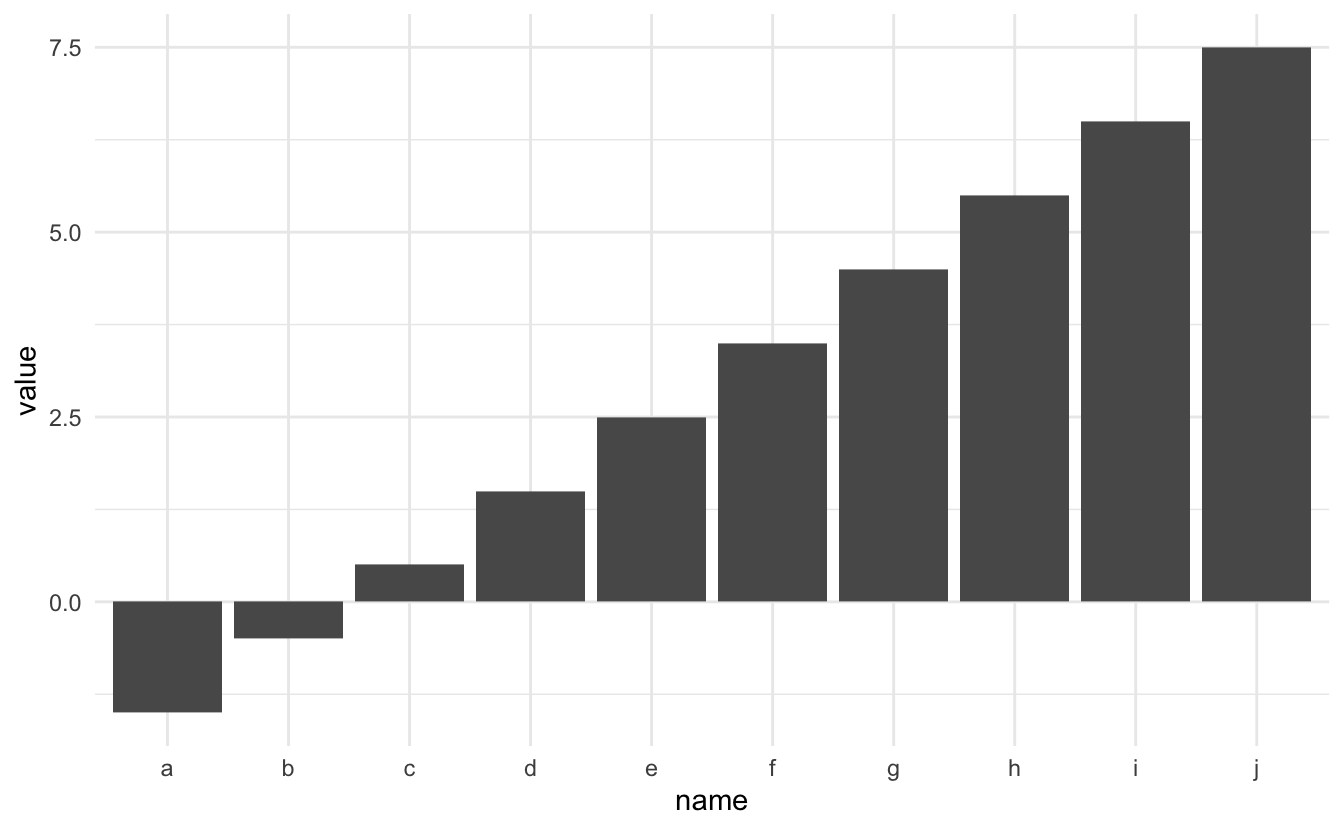
Next, let’s add some color by assigning the value to the fill aesthetic.
ggplot(example_data, aes(name, value, fill = value)) +
  geom_col()
Using a sequential palette for a chart like this doesn’t give us much insight. Lets add a divergent scale with scale_fill_gradient2(). While it is doing its job, you still have to define the colors yourself.
ggplot(example_data, aes(name, value, fill = value)) +
  geom_col() +
  scale_fill_gradient2()
Lets instead use the scale_fill_distiller() function to access the continuous versions of the brewer scales.
ggplot(example_data, aes(name, value, fill = value)) +
  geom_col() +
  scale_fill_distiller(type = "div")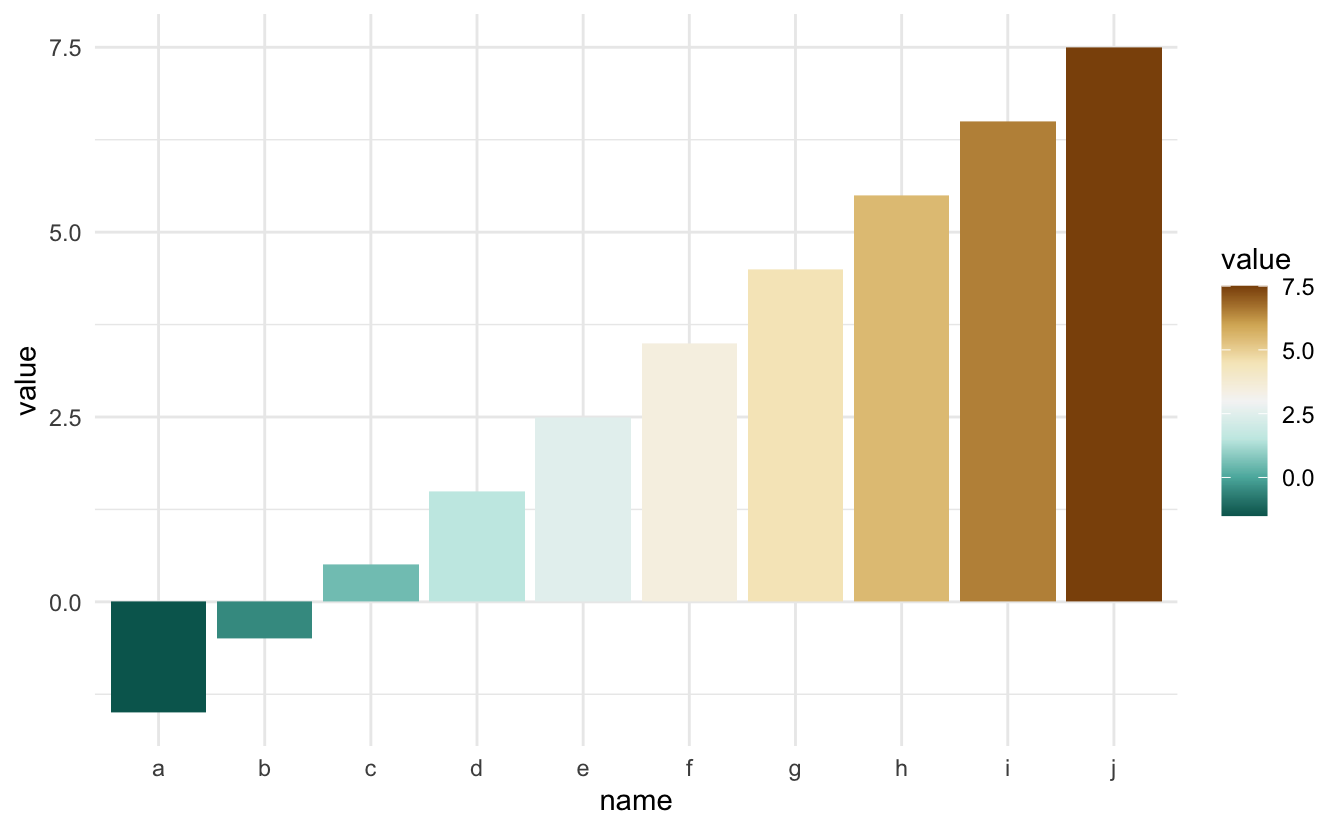
But look! some of the upwards-facing bars are colored green instead of orange.
The solution
The solution is to manually specify the limits of the color palette such that the center of the palette appears in the middle of the range. This is simply done by finding the absolute maximum of the range of the variable to are mapping to the color. We then set the limits to go from negative max to positive max, thus making zero appear in the middle.
limit <- max(abs(example_data$value)) * c(-1, 1)

ggplot(example_data, aes(name, value, fill = value)) +
  geom_col() +
  scale_fill_distiller(type = "div", limit = limit)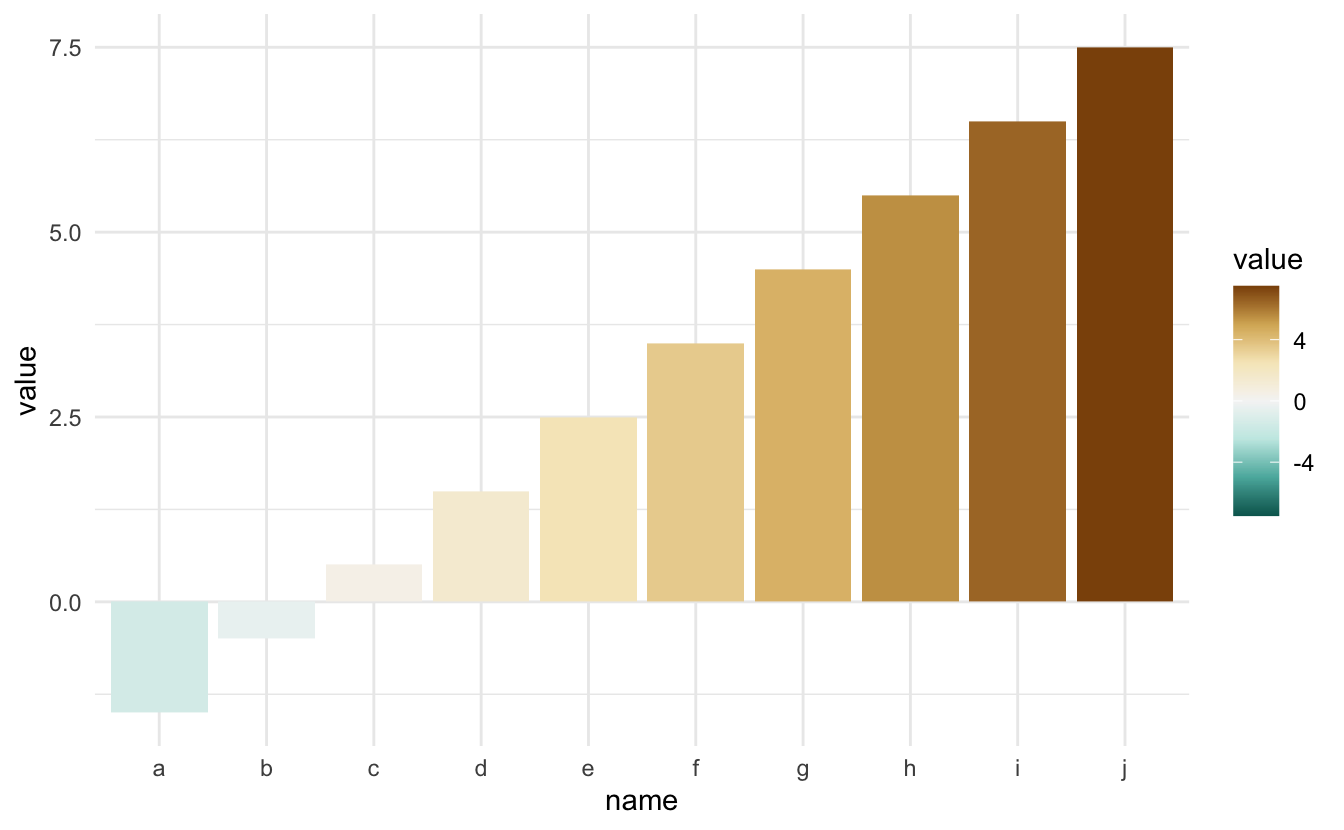
This approach also works with the scico package.
limit <- max(abs(example_data$value)) * c(-1, 1)

ggplot(example_data, aes(name, value, fill = value)) +
  geom_col() +
scale_fill_scico(palette = "cork", limit = limit) 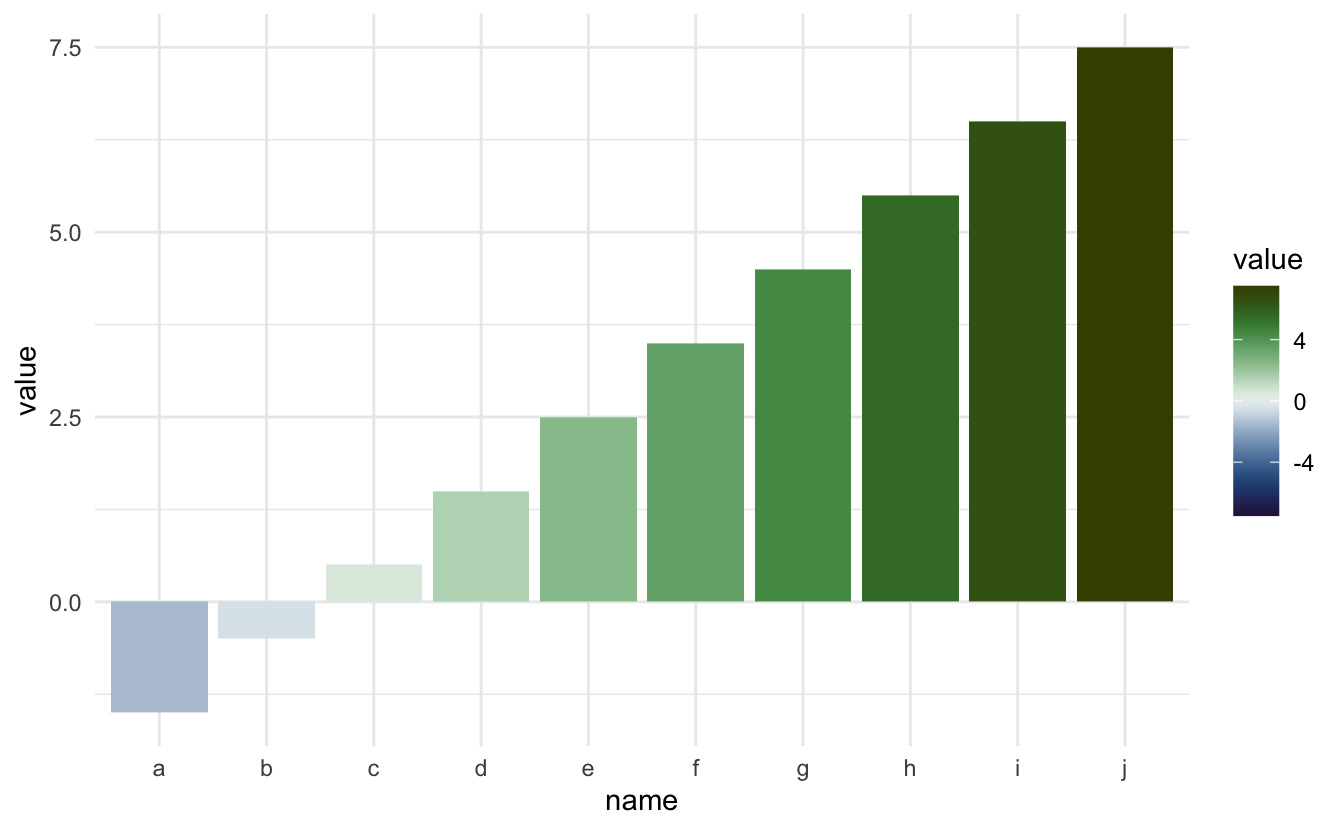
session information
─ Session info ───────────────────────────────────────────────────────────────
 setting  value
 version  R version 4.1.0 (2021-05-18)
 os       macOS Big Sur 10.16
 system   x86_64, darwin17.0
 ui       X11
 language (EN)
 collate  en_US.UTF-8
 ctype    en_US.UTF-8
 tz       America/Los_Angeles
 date     2021-07-15

─ Packages ───────────────────────────────────────────────────────────────────
 package      * version date       lib source
 assertthat     0.2.1   2019-03-21 [1] CRAN (R 4.1.0)
 blogdown       1.3.2   2021-06-09 [1] Github (rstudio/blogdown@00a2090)
 bookdown       0.22    2021-04-22 [1] CRAN (R 4.1.0)
 bslib          0.2.5.1 2021-05-18 [1] CRAN (R 4.1.0)
 cli            3.0.0   2021-06-30 [1] CRAN (R 4.1.0)
 clipr          0.7.1   2020-10-08 [1] CRAN (R 4.1.0)
 codetools      0.2-18  2020-11-04 [1] CRAN (R 4.1.0)
 colorspace     2.0-2   2021-06-24 [1] CRAN (R 4.1.0)
 crayon         1.4.1   2021-02-08 [1] CRAN (R 4.1.0)
 DBI            1.1.1   2021-01-15 [1] CRAN (R 4.1.0)
 desc           1.3.0   2021-03-05 [1] CRAN (R 4.1.0)
 details      * 0.2.1   2020-01-12 [1] CRAN (R 4.1.0)
 digest         0.6.27  2020-10-24 [1] CRAN (R 4.1.0)
 dplyr          1.0.7   2021-06-18 [1] CRAN (R 4.1.0)
 ellipsis       0.3.2   2021-04-29 [1] CRAN (R 4.1.0)
 evaluate       0.14    2019-05-28 [1] CRAN (R 4.1.0)
 fansi          0.5.0   2021-05-25 [1] CRAN (R 4.1.0)
 farver         2.1.0   2021-02-28 [1] CRAN (R 4.1.0)
 generics       0.1.0   2020-10-31 [1] CRAN (R 4.1.0)
 ggplot2      * 3.3.5   2021-06-25 [1] CRAN (R 4.1.0)
 glue           1.4.2   2020-08-27 [1] CRAN (R 4.1.0)
 gtable         0.3.0   2019-03-25 [1] CRAN (R 4.1.0)
 highr          0.9     2021-04-16 [1] CRAN (R 4.1.0)
 htmltools      0.5.1.1 2021-01-22 [1] CRAN (R 4.1.0)
 httr           1.4.2   2020-07-20 [1] CRAN (R 4.1.0)
 jquerylib      0.1.4   2021-04-26 [1] CRAN (R 4.1.0)
 jsonlite       1.7.2   2020-12-09 [1] CRAN (R 4.1.0)
 knitr        * 1.33    2021-04-24 [1] CRAN (R 4.1.0)
 labeling       0.4.2   2020-10-20 [1] CRAN (R 4.1.0)
 lifecycle      1.0.0   2021-02-15 [1] CRAN (R 4.1.0)
 magrittr       2.0.1   2020-11-17 [1] CRAN (R 4.1.0)
 munsell        0.5.0   2018-06-12 [1] CRAN (R 4.1.0)
 pillar         1.6.1   2021-05-16 [1] CRAN (R 4.1.0)
 pkgconfig      2.0.3   2019-09-22 [1] CRAN (R 4.1.0)
 png            0.1-7   2013-12-03 [1] CRAN (R 4.1.0)
 purrr          0.3.4   2020-04-17 [1] CRAN (R 4.1.0)
 R6             2.5.0   2020-10-28 [1] CRAN (R 4.1.0)
 RColorBrewer   1.1-2   2014-12-07 [1] CRAN (R 4.1.0)
 rlang          0.4.11  2021-04-30 [1] CRAN (R 4.1.0)
 rmarkdown      2.9     2021-06-15 [1] CRAN (R 4.1.0)
 rprojroot      2.0.2   2020-11-15 [1] CRAN (R 4.1.0)
 sass           0.4.0   2021-05-12 [1] CRAN (R 4.1.0)
 scales         1.1.1   2020-05-11 [1] CRAN (R 4.1.0)
 scico        * 1.2.0   2020-06-08 [1] CRAN (R 4.1.0)
 sessioninfo    1.1.1   2018-11-05 [1] CRAN (R 4.1.0)
 stringi        1.6.2   2021-05-17 [1] CRAN (R 4.1.0)
 stringr        1.4.0   2019-02-10 [1] CRAN (R 4.1.0)
 tibble         3.1.2   2021-05-16 [1] CRAN (R 4.1.0)
 tidyselect     1.1.1   2021-04-30 [1] CRAN (R 4.1.0)
 utf8           1.2.1   2021-03-12 [1] CRAN (R 4.1.0)
 vctrs          0.3.8   2021-04-29 [1] CRAN (R 4.1.0)
 withr          2.4.2   2021-04-18 [1] CRAN (R 4.1.0)
 xfun           0.24    2021-06-15 [1] CRAN (R 4.1.0)
 xml2           1.3.2   2020-04-23 [1] CRAN (R 4.1.0)
 yaml           2.2.1   2020-02-01 [1] CRAN (R 4.1.0)

[1] /Library/Frameworks/R.framework/Versions/4.1/Resources/library